Vielleicht sehen wir in nicht allzu ferner Zeit die "Biggest short covering panic of our lifetimes", schaun mer mal ;-))
Chief Commentator, Peter Grandich, has offcially shed his permabear skin according to his latest blog post. This is a pretty important declaration because Grandich has an uncanny ability to call market [...]
Special Alert - Bye, Bye Permabear Camp - It’s Been Great!
About 18 months ago, after correctly calling for one more stock market rally on the heels of a Fed easing, I put on a permabear suit just two days after the DJIA made an all-time high. I remained (Thank God) a growling bear up until now. I’ve grown fat “feasting” on bull meat (Thanks in part to CNBC-TV and their constant parade of blind bulls). While my fellow bears can still feast for a while longer, I’ve learned after 25 years it’s always better to be a year too early then a day too late.
Now before my fellow bear followers scream “traitor” and question how can my cup go from half empty to half full, please note I’m not applying for membership in the “Don’t Worry, Be Happy” crowd. I tend to be early for everything (appointments, airplanes, buying NY Jets Superbowl tickets, etc.). I just believe that based how well we’ve done overall these last 18 months, and all the possible scenarios I envision going forward at this point, the time has come to implement a program that appears to be prudent and offers potential gains from the long side. Even if my worst case scenario unfolds, the net effect should still be that being a permabear greatly lessened the hit one would’ve had otherwise.
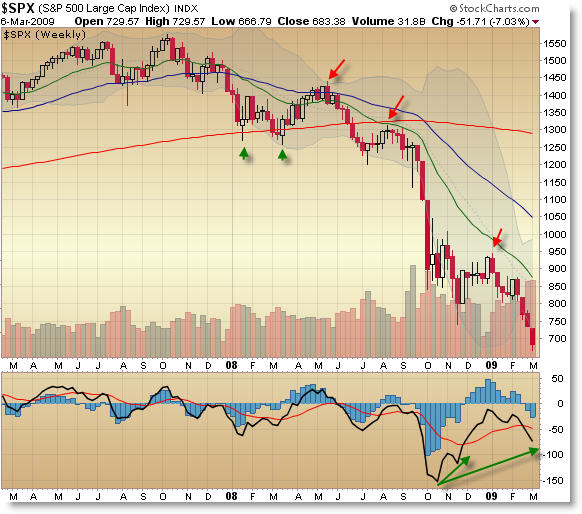
At the minimum, we’re overdue for a sharp bear market rally. Never have my technical indicators suggested so in almost 25 years. Several market indexes are dramatically below key moving averages. Several have never seen this far of a spread between price and moving average while others only once or twice. Knowing in technical analysis you must look only at the charts, I do believe anyone experienced in this type of analogy would suspect as I do that a significant correction of an almost straight-down decline is overdue.
This belief is not the sole reason for my “change” (I’ve come not to like that word in the last year or so). When I started in the business 25 years ago, the investment community and investors usually used a 3 to 5 year outlook. Thanks to a desire to truly have a chicken in every pot, long-term investing became as short as 3-5 minutes. Yes, buy and hold was finally blown up (and thankfully as yours truly as called it one of the myths created by traditional financial planning). But unless one believes the world as we know it is gone and guns, dry foods and a cabin in the mountains is all we’ve to look forward to, I do think it’s come time to be selective on the long side again. One must realize that making 10% a day, week or even month, was never a good goal and is not likely for the foreseeable future. 10% a year gain versus 25%-75% losses a year should be more than acceptable going forward.
So here’s my plan knowing it’s not only subject to change, but remembering those of us who try and make a living looking into a crystal ball, only end up learning how to eat lots of broken glass.
One market I turned bullish on back on December 18, 2008 is oil. I’ve waited to take any significant positions in equity oil stocks because at that point I felt there were still lots of downside left in the overall market. That decline indeed came and combined with the fact that since then oil appears more and more each week to have put in a long-term bottom, I think one of the ways to get back in the stock market is through oil stocks. Even if the overall market doesn’t improve or worse, goes lower, I think oil stocks can outperform.
I also think we can at least return back to a stock pickers market. The $64,000 question is how one should allocate funds going forward. A lot of that will have to do with age, financial and emotional condition, and a series of other factors that makes one size fits all impossible. Therefore, discuss with your adviser before making any decisions.
The most conservative way would be either a scale-down or up program. This is where you make and/or add to positions based on the price of what you’re looking to buy goes down to or up to certain levels. This is not dollar cost-averaging because you only act if certain levels are reached. The older and more conservative investor is most likely to use a scale down approach. If we go straight up from here, you’ll have some exposure. If we do go lower, you should be buying at lower levels. Remember, I’m suggesting this because we’ve the luxury of not being heavily exposed to the large losses suffered in most markets. The younger more speculative investor (remember, the word speculative is really another word for gambling) can be more aggressive and be able to financially and mentally afford the risks of the market losing another 25% or so.
A couple of more suggestions; I do believe most equity players should at least be even weight, if not over-weight, in foreign markets. The tendency for individual investors is to buy mostly U.S. stocks. The chances of a “V” bottom are small. Whatever low we make before a bear market rally is likely to be retested at least once. An “L” bottom is the most likely scenario (which usually means only a selective stock picker can have any real chance for gains).
I want to make it perfectly clear; the stock market can still go substantially lower before any real bottom. The chances of it going straight up from here are like the Vancouver Canucks winning the Stanley Cup - slim or none.
U.S Stocks - If this was a normal recession, I would be jumping back in with both feet. However, all the bearish indicators I’ve spoken of late remain. The only thing different is risk/reward appears at least balanced now (DJIA 5,000 or 8,000 appear to have similar chances). Because I missed all the downside since the all-time high, if we go down to 5,000 from here, the net effect would mean I still prevented far bigger losses if I had been bullish up until now. After 25 years in and around the markets, I’ve learned if you can live with the worst case scenario both financially and mentally (mental anguish from losses is usually much harder to deal with then financial losses), then nothing unexpected should occur. I no longer believe it’s worthy to sell rallies and one should now look to buy declines (but only on a scale-down basis).
Oil - Per my December 18th alert, I returned to the bullish camp at $36.50 a barrel. Since then, oil has been tracing out a very good bottom despite an onslaught of truly bearish news. Again, after 25 years (and enough losses to last a lifetime) I’ve learned that when a market fails to go in the direction the fundamental news strongly suggests it should, it’s clearly signaling the market has just about priced in the news and sellers or buyers have exhausted themselves. Such appears the case for oil. While one shouldn’t expect a straight up move, the risks appears to be $10 lower and $50 higher in the next 12 months.
Precious Metals - I remain very bullish on precious metals. I don’t believe general equities are entering a new secular bull market and therefore won’t take away reasons to own gold. In fact, they appear to have strong potential to co-exist for awhile based on my belief that deflation is going to be replaced by inflation before most perceive at this time. In the early stages of inflation, general equities will be enhanced but eventually higher inflation should put an end to whatever run the stock market has. Precious metals meanwhile, should continue higher.
Base Metals - While it’s too early to get back in on them except in a few selective equity plays, I continue to believe that metals like copper not falling even close to past major lows, continues to suggest the great supplies of metals once around the world is no longer a key bearish factor. The fact that so many mines shut down so fast and most of the best projects have already been well-developed, suggests when the world does recover from this spiraling deflation, base metals can come roaring back. Stay tuned.
U.S Dollar - Despite all sorts of talk about a strong U.S. dollar and great gains over the last year or so, the U.S. Dollar Index remains trapped in a narrow trading range. Again, when the market isn’t fir-filling the expectations of the majority, it does many times suggest that belief is already baked into the price. I also believe its way overblown in how well the dollar has supposedly down. The Index went from 120 to 70 and has only managed to retrace not even half of that loss. If the dollar was truly still a safe haven, it would be much, much higher and gold wouldn’t be even close to $1,000 an ounce.
U.S. Bonds - I think the no-brainer play is shorting the 10 and 30 year Treasuries. Interest rates can only go much higher over the coming years no matter what the economy does. There’s no instant gratification in this trade unless you’re trading the futures themselves, but at the same time, it’s the least risky of all the suggested plays of mine. Sorry Uncle Sam.
http://grandich.agoracom.com/2009/03/...mp-its-been-great-1100pm-est/ 
http://www.ironandwine.com/


